Thermal comfort analysis.
BSRIA's CFD analysis put the same 800 W of heat into an identical room three ways. ThermaSkirt held comfort temperature in a 3°C band and delivered 2°C higher mean comfort than a radiator under the window, the most uniform result of the three.
Same heat, delivered at the perimeter, lands more evenly.
BSRIA modelled a 4 m × 4 m room by computational fluid dynamics and compared three ways of delivering an identical 800 W heat load: a panel radiator under the window, the same radiator on the internal wall, and ThermaSkirt distributed around the perimeter.
Measured at head height (1.2 m), ThermaSkirt produced the tightest, most uniform comfort-temperature field of the three. The figures on this page are taken directly from BSRIA Report 51397/1, January 2008.
- BSRIA modelled the same 800 W heat load delivered three ways in an identical 4 m × 4 m room: a radiator under the window, a radiator on the internal wall, and ThermaSkirt distributed around the perimeter (Report 51397/1, January 2008).
- ThermaSkirt held comfort temperature within a 3°C band (18.7–21.7°C) at head height; the radiator under the window swung from 16.8°C in cold corners to a 29.3°C plume.
- ThermaSkirt was the most uniform of the three, with a comfort-temperature standard deviation of 0.32 versus 0.89 and 1.37 for the two radiator positions.
- At the same 800 W load, ThermaSkirt delivered a 2°C higher mean comfort temperature (20.2°C) than the radiator under the window (18.2°C).
- The radiator-under-window model produced comfort temperatures as low as 16.8°C in the corner between the two windows; ThermaSkirt eliminated those cold spots by emitting at the perimeter.
- Comfort (operative) temperature combines air temperature and mean radiant temperature; raising the radiant temperature at the perimeter lets the same comfort be reached at a lower air setpoint.
What did BSRIA measure?
A steady-state CFD simulation (Flovent, LVEL k-ε turbulence model, radiation on) of one room, with everything held constant except the heat emitter and its position. Comfort temperature, air temperature and air velocity were computed across nine horizontal slices of the room.
Tighter, warmer, more uniform, at the same heat load.
Comfort temperature at head height
Each bar shows the spread of comfort (operative) temperature across the room at 1.2 m above the floor, with the mean marked. A short bar centred on the target is what a specifier wants: even comfort, no cold corners, no overheated plume.
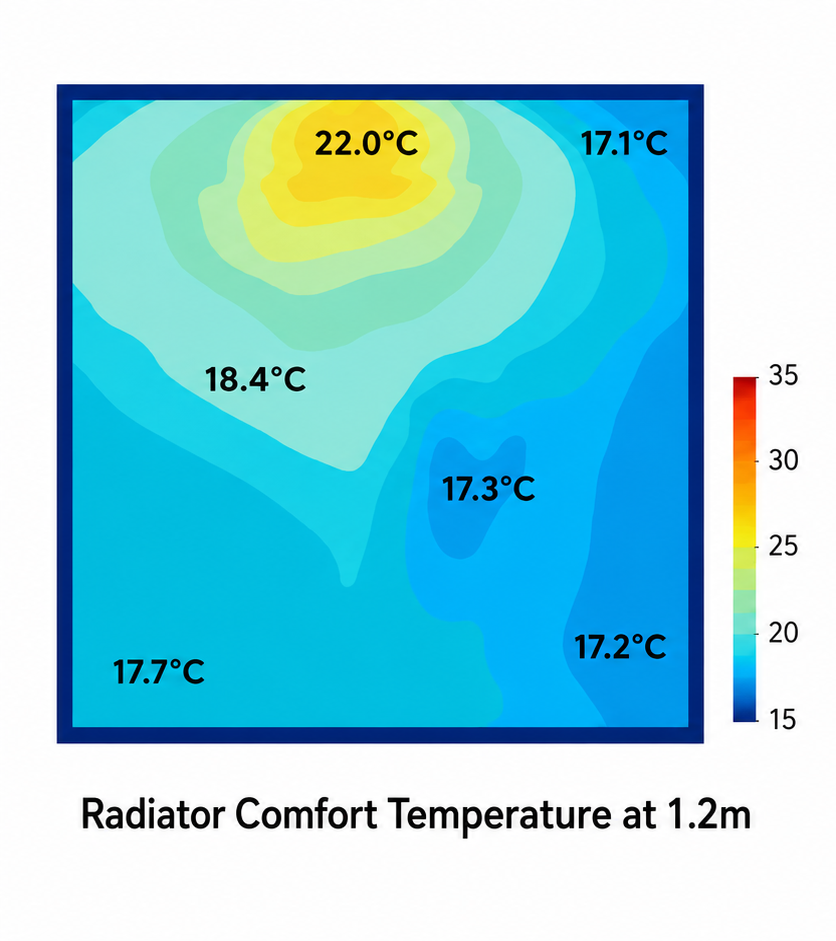
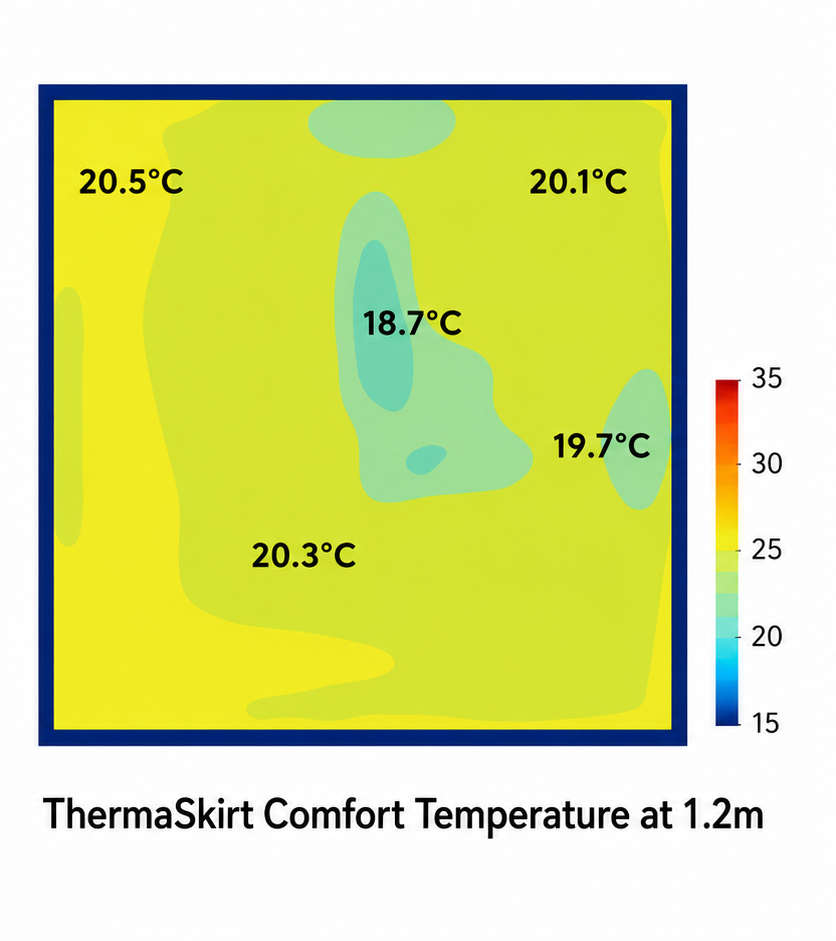
Comfort-temperature field at 1.2 m above floor, sampled annotation points from BSRIA Report 51397/1, January 2008.
| Emitter & position (800 W) | Min | Mean | Max | Std dev |
|---|---|---|---|---|
| Radiator under window | 16.8°C | 18.2°C | 29.3°C | 0.89 |
| Radiator at internal wall | 18.4°C | 19.9°C | 30.4°C | 1.37 |
| ThermaSkirt | 18.7°C | 20.2°C | 21.7°C | 0.32 |
BSRIA Report 51397/1, “CFD Analysis of ThermaSkirt”, January 2008, Table 3. Comfort temperature evaluated at the plane 1.2 m above floor. BSRIA concluded ThermaSkirt “has the most uniform distribution and the most acceptable level among all simulations.”
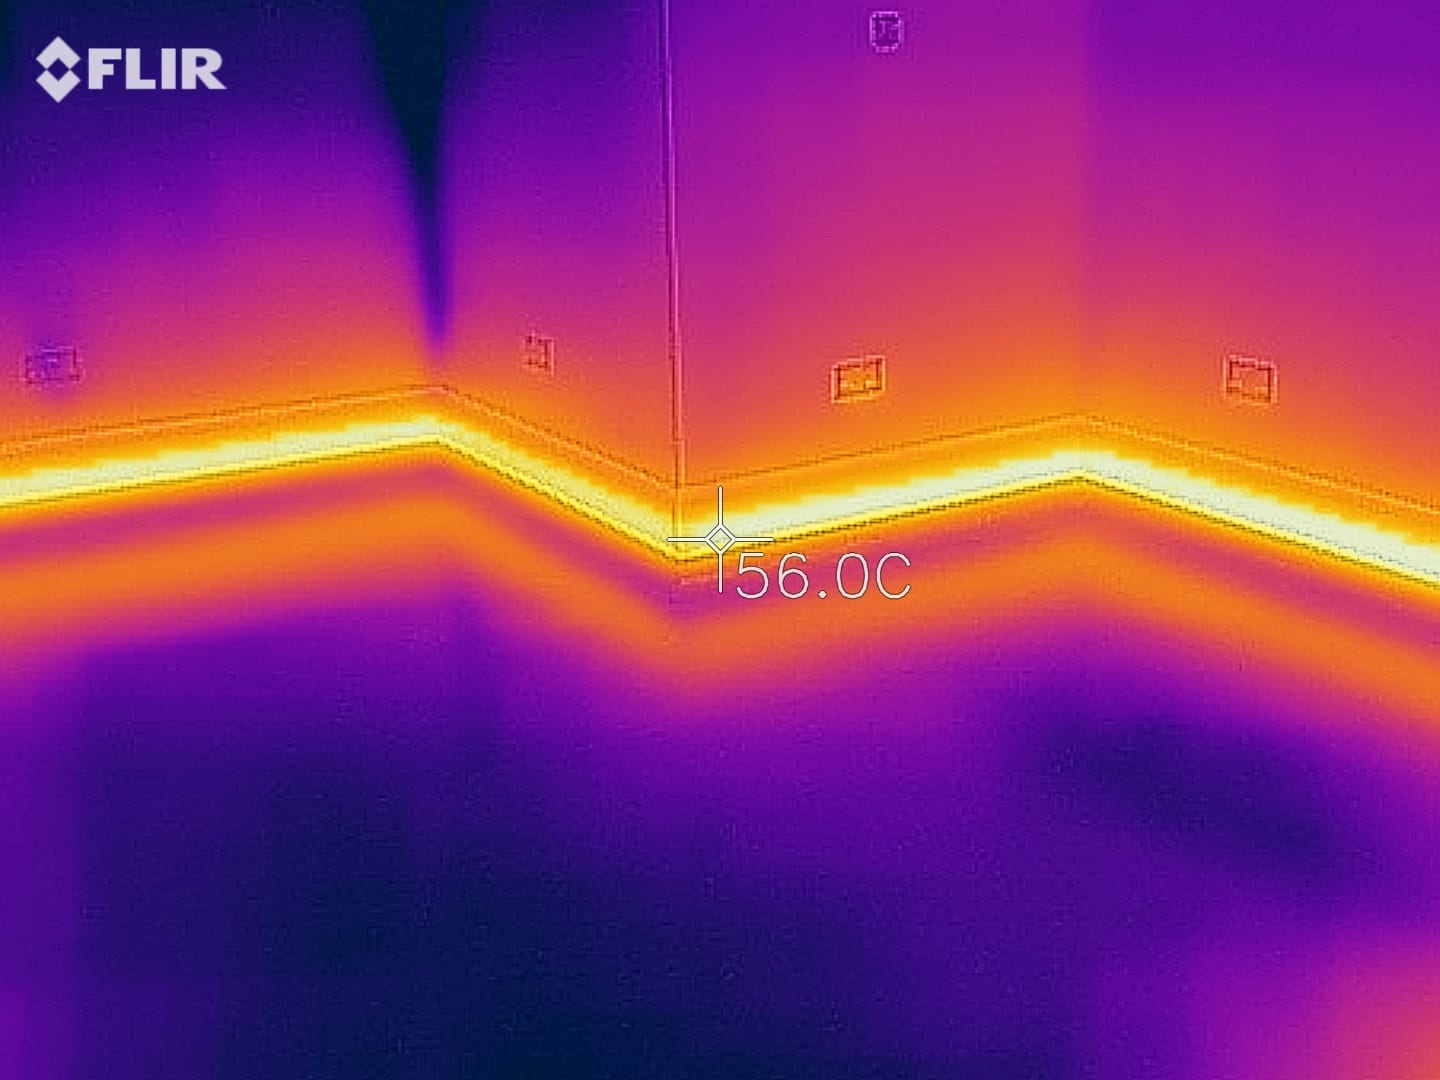
Convection plume vs radiant envelope
A radiator heats one wall and drives a hot plume to the ceiling, leaving the far side of the room to cool. ThermaSkirt warms the whole perimeter, wrapping the room in an even radiant envelope.
Why heating the perimeter matters
A room loses most of its heat through its coldest surfaces: external walls, windows and the corners between them. A single radiator heats one wall and relies on circulating air to carry warmth to the rest of the room, which leaves the far corners cold. In the CFD, the radiator under the window dropped to 16.8°C in the corner between the two windows.
ThermaSkirt emits along the perimeter, warming those external surfaces directly. That lifts the mean radiant temperature exactly where it is normally lowest, which is why the ThermaSkirt field has no cold corners and the tightest spread.
Less warm air stacked at the ceiling
A convector radiator drives a strong upward plume: the CFD recorded comfort temperatures up to 29.3–30.4°C directly above the radiators, heat that collects near the ceiling rather than where people are.
Emitting low down and around the room keeps the floor-to-ceiling gradient shallow, so more of the heat ends up in the occupied zone. That is the mechanism behind ThermaSkirt's flatter, more uniform comfort field.
Why even comfort allows a lower setpoint
What people feel is operative temperature, roughly the average of the air temperature and the mean radiant temperature of the surrounding surfaces. BSRIA's “comfort temperature” is this operative temperature.
By raising the radiant temperature of the room's surfaces, ThermaSkirt reaches the same operative comfort at a lower air temperature. That means the thermostat can be set lower for equal comfort, which reduces consumption. This is a consequence of the comfort mechanism, not a separate efficiency claim, and the size of any saving depends on the dwelling.
Raise the radiant half, and the same comfort is reached with a lower air temperature.
Everything you need to know
What did the BSRIA thermal comfort test actually measure?
How much more uniform was ThermaSkirt?
Was the heat output the same in every case?
Why did the radiator leave cold corners?
Does better comfort mean lower running cost?
Is this comfort finding the same as the efficiency results?
Can I get the full BSRIA report?
Explore related Technical Data
Real-dwelling corroboration, the underlying physics, and the product data behind the comfort result.

Specifying for comfort and Part O?
Our technical team can supply the full BSRIA analysis and heat-loss-matched ThermaSkirt schedules to support your comfort and overheating case.